


-
Home

- Blog
Latest news and information
- Details
- Hits: 437
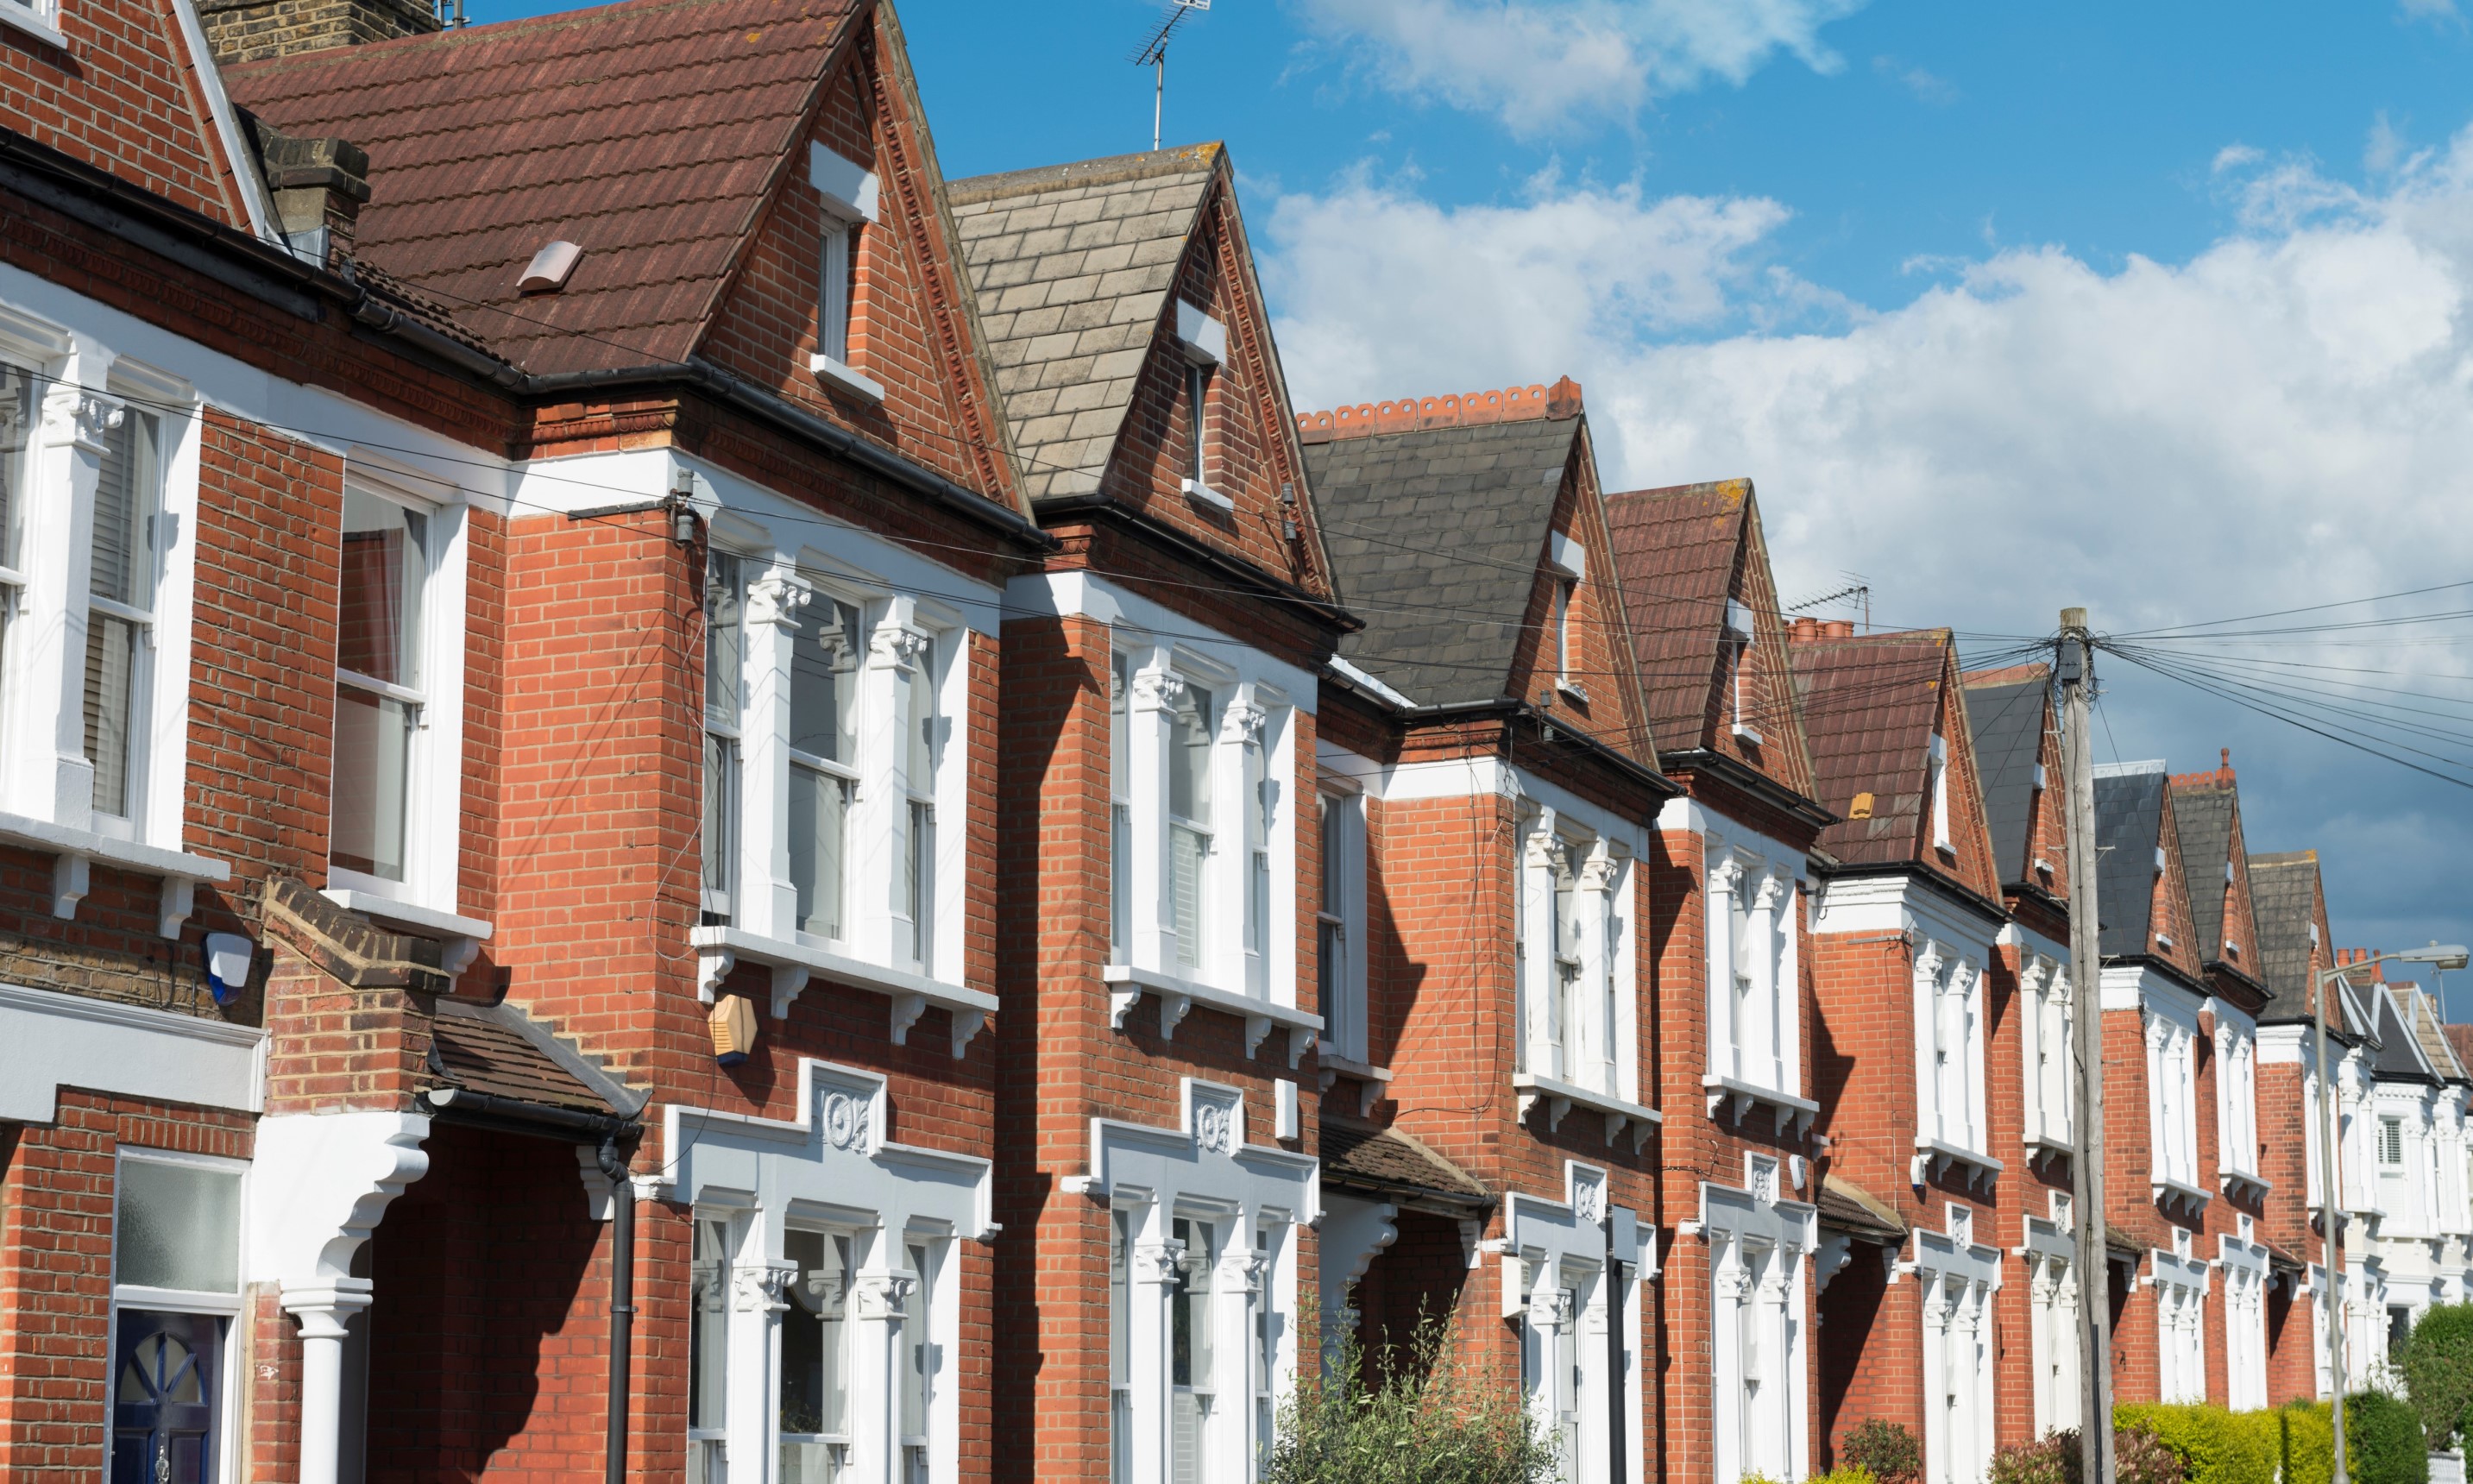
You may have seen one or two alarming headlines this week. "Private rented sector shrinks by £79 billion since 2022." "Buy-to-let exodus wipes £48bn from rentals."
To mention a few.
If you're a landlord, it's the kind of thing that can make you seriously pause for thought. And we understand that. Those numbers do sound catastrophic.
But before you call us in necessarily to sell off your existing portfolio, let's actually look at what Savills' analysis – the source behind the £79bn figure – is really telling us, because there's a difference between a market that's contracting and a market that's collapsing.
And here in Oxford, right now, where almost 20,000 households live in privately rented accommodation and where average rental values are now almost £1,918 per month (source: Dataloft by Pricehubble), the difference matters enormously.
What Do the Numbers Actually Say?
Savills puts the total value of England's privately rented homes at £1,556 billion in 2022, falling to £1,477 billion by late 2025, a net drop of 5.1% over three years. And that might be a little alarming, when you consider that the bricks-and-mortar value of properties, generally speaking, has increased in that time. In other words, the shrinkage isn't about falling prices. It's very much about fewer rental properties overall.
But as is so often the case, there is a bit of nuance to consider.
Here's what seems to be happening: traditional smaller landlords – the classic “individual” landlord with one to four properties alongside a full-time career – are selling up to owner-occupiers faster than new buy-to-lets are coming online.
Truthfully, we can all see reasons why. CGT jumping to 24% for residential property (up from 18%), frozen thresholds, plus the administrative weight of the Renters' Rights Act have tipped the scales for plenty of landlords who were already on the fence.
We hear it directly from our own clients. Higher taxes and higher costs to maintain properties, EPC requirements tightening, legislation changes that loom large. There are definitely added costs that weren't on the spreadsheet just two or three years ago. The arithmetic has changed, and it is true that some landlords are deciding it simply no longer adds up. However, whilst it is true that this is happening, there is more to the story – as we will show.
Why Landlords Selling Up Matters (For Everyone)
A smaller private rented sector means tighter supply, and that creates upward pressure on rents for the very tenants that recent changes are intended to help.
Rents rose 8.5% nationally last year. Here in Oxford the rise was even more staggering – up by 14% year on year according to Dataloft analysis.
The lettings picture generally would seem to be one where tenants have fewer options and landlords face more scrutiny. None of this happens in a vacuum.
But the headlines are missing some key information that really matters in order to paint the full picture.
Because the reality is that it's not all doom and gloom. Not even close.
Whilst there has been an undeniable shrinkage in the PRS, corporate landlords and institutions have, at the same time, been more active, buying up portfolios from many small landlords who have decided to exit, cushioning the net loss.
Other landlords – maybe the larger-type of smaller-landlord, for want of an easier way to describe them, with slightly larger portfolios – have moved their properties into a corporate structure (note – it doesn’t suit everyone, and before you rush to do this, it is key to talk to a professional advisor about what it entails!).
Overseas investors have put roughly £40 billion into UK build-to-rent over the past decade, with around £30 billion going into professionally managed blocks, much of it post-2022 (as revealed by Knight Frank in a separate news article last week).
It's not your traditional mum-and-dad buy-to-let model, and the timelines being discussed by Knight Frank’s analysts compared to Savills do differ. That said, it does clearly help to stabilise supply in some high-demand areas.
Whilst all that is happening, the buy-to-let sales market isn’t dead at all. There is a new profile of landlords quietly but actively getting on with it. Millennials and Gen Z investors are stepping into the breach, often via limited companies from the very start in order to sidestep the personal CGT and income tax issues that are encouraging older landlords out.
These are tax-savvy, tech-enabled landlord buyers, laser-focused on yield but also professionalised in their approach. In many ways, they're exactly the profile built for the current regulatory environment.
The Oxford Lettings Picture
The £79bn figure is a UK-wide average, and averages are notoriously good at hiding what's actually happening on the ground.
In Oxford, when it comes to rental stock, demand is consistently outstripping supply. Rents are up 14% year-on-year, as mentioned, and the sector is well supported by a professional and student lettings market. With two universities, a number of major and specialist hospitals, and an incredibly strong and growing research and technology sector, Oxford’s rental demand remains robust.
Yields are also typically beating savings rates – although this is more marginal. Nevertheless, when it comes to investing in Oxford, it is often less about the yield and more about the capital value. Institutional money is targeting managed blocks here, while quality single lets, like many of the homes we look after, continue to hold firm and attract strong demand from tenants locally.
If you own well-maintained property in Oxford and you're managing it properly, this still feels like a hold market, not a sell market – and anecdotally speaking, relatively few of the landlords whose properties we let and manage have opted to sell at this stage whilst rents are so strong and rising.
The Bottom Line
It is certainly a time to be mindful – but there is no need to panic. Now would be a wise moment to review your tax position, review your capital value and yield achieved, and even to do some general housekeeping ahead of legislation changes before they come in – i.e., checking your EPC rating is up to what the new standards will require in 2030 (if it comes to pass), and making sure your compliance is watertight as the Renters’ Rights Act implementation begins to roll in from 1 May 2026.
The Private Rented Sector is certainly not vanishing. But in many ways, it might be professionalising. The loss of value from the PRS might in truth be more representative of a changing reality for lettings in general – a move to professional corporate letting structures, for example, rather than a sign that a black hole is swallowing the market and leaving would-be tenants stranded.
The landlords who are thriving right now are the ones working with experienced, dedicated agents, staying ahead of regulation, and making decisions based on data rather than headlines.
Whether you're weighing up whether to hold, to sell tax-efficiently, are exploring a limited company structure, or are simply wondering whether it is time to place your property in the hands of a professional agent, we're here to help you model all scenarios properly – not to guess at them.
Is it a good moment to have a conversation about your portfolio? Get in touch with us here at Cherry Picked Residential today.
- Details
- Hits: 437

Picture this: you’ve just purchased your dream home, and it’s beautiful! All the right-sized rooms, a perfect layout, and a lovely garden to boot…
But now imagine, after a few months, you find out there is a serious problem with the foundations that will cost tens of thousands to fix and will make it difficult to insure or sell the property in the future.
Also imagine how it feels to realise at that point that it is a problem that would have been identified by the right survey...
Buying a property is exciting, but it’s also sensible to stop for a moment and ask yourself, 'What am I really buying?'
This is where a survey comes into its own.
A survey doesn’t tell you whether to love a home or not. It tells you what shape the property is in and highlights any issues you should know about before you commit.
The survey’s findings aren’t meant to stop you from buying. They help you understand what moving forward really involves.
But which sort of survey should you go for?
This article explains the different types of surveys and when each one is most suitable.
The Three Levels of RICS Surveys Explained
In the UK, surveys under the Royal Institute of Chartered Surveyors (RICS) are organised into three levels, which makes it easier to pick the right one for your needs.
Level 1 (or ‘Condition Report’)
Often taken for:
- New-builds
- Recently built homes
- Properties that might seem to be in very good condition, but you still want a professional to check them.
A Level 1 survey is the most basic option. It gives you:
- A snapshot of the property’s overall condition
- Clear “traffic light” ratings for different elements
- Potential identification of urgent issues
It doesn’t look beneath the surface or check things that aren’t visible. If it finds issues, it won’t provide detailed advice about repairs or cost estimates. Think of it as a health check, not a diagnosis. It can highlight areas that may need a closer look, which we’ll discuss later.
Level 2 (or ‘Homebuyers Report’)
Good for:
- Most conventional homes
- Properties built after around 1900
- Homes that look fairly typical for their age and type
A Level 2, the ‘Homebuyers Report’, is a popular choice for buyers. These offer:
- A more detailed inspection of the property, including deeper checks
- Advice on defects and potential problems
- Guidance on repairs and maintenance
- A market valuation and reinstatement cost (if requested)
It’s ideal if you want reassurance without forensic detail, although the detail it provides is still comprehensive.
The report uses a traffic-light system to help you quickly spot urgent and less urgent issues.
One word of caution: red flags don’t always mean major problems. Something that can’t be inspected could be listed with a red flag – for example, electrics. A red flag here doesn’t necessarily mean the property needs a full rewire – it might just mean that the surveyor recommends you get the electrics checked by a qualified person because they were unable to be tested on the day.
Don’t panic if you see amber or red flags. Read the surveyor’s comments, which are intended to inform you and help you decide what to do next.
Level 3 (a Building Survey)
Often taken for:
- Older properties
- Period homes
- Homes with visible issues
- Properties you plan to renovate or extend
This is the most comprehensive survey available and what people often mean when they say “full structural survey”, although that term is no longer officially used. The other option is a structural engineer’s report, but those really focus on other things - i.e., those things pertaining to the structure itself - and won’t look at issues that might otherwise concern you as a buyer (for example, damp).
A Level 3 survey:
- Looks at the structure and fabric of a building in detail
- Explains defects, their causes, and likely consequences if not addressed
- Offers advice on repairs and future maintenance
- Is hyper-focussed on the specific property
If the property is unusual, historic, or clearly in need of work, this is usually the best choice. It again uses the traffic light system, but with more detail provided. This can help you focus on what really matters and give advice in a way that’s more reassuring for issues that aren’t serious.
Do “Full Structural Surveys” Still Exist?
The term ‘full structural survey’ is still widely used in conversation, but under current standards, it has been replaced by the Level 3 Building Survey, which serves the same purpose and is more clearly defined.
If someone suggests a “full structural survey”, they’re almost certainly referring to a Level 3 – but as mentioned earlier, they could mean a structural engineer’s report.
These are not the same thing and are not carried out by RICS surveyors.
Specialist Surveys When Buying a Property
Sometimes a general survey recommends further investigation by a specialist. This isn’t necessarily a bad sign – it is often just a sensible next step recommended by a professional.
Think of it like a GP picking up an irregular heartbeat. They don’t strap the patient down and fit them with a pacemaker; they refer them to a cardiologist to find out what’s going on.
Maybe they do need a pacemaker… or maybe this is just the way they are, and no harm will come from it. The point is, the specialist is there to work that out and tell them.
It’s the same with properties and surveys. Common specialist surveys include:
- Electrical survey – checks wiring, safety, and compliance with modern regulations
- Gas survey – checks boilers, heating systems, and other gas appliances, such as cookers and hobs.
- Damp and timber survey – inspects and measures for damp, rot, or woodworm.
- Asbestos survey – especially relevant in properties built in the last century (i.e., up to 1999, when asbestos was entirely banned!) and even more especially pre-1985, when blue and brown asbestos was banned.
- Drainage survey – checks underground pipes and drainage.
- Roof survey – useful if access was limited during another survey or if the surveyor, buyer, or anyone helping the buyer identifies concerns, such as bowing
These are usually targeted and practical, focusing on a specific risk rather than the whole property.
So… Which Survey Should You Choose?
You should take whatever survey gives you full peace of mind.
Nevertheless, to offer you a general guide:
- Newer, straightforward home? Level 1 or Level 2
- Typical family house? Level 2, unless you have any anxiety or concerns
- Older, altered, or character property? Level 3
Your decision should be based on the property and the risk, not just the price.
Parts of Oxford were settled during Roman times, and the early town grew as an ecclesiastic and scholarly centre into a bustling metropolis by standards of the day, during the early Medieval period. It grew further throughout the Middle Ages, Reformation and Renaissance periods.
Nevertheless, when it comes to housing, much of today’s Oxford developed from the 18th century onwards, as the University expanded, and once the railway arrived. Large areas of the city are made up of Victorian terraces, many of which were erected – quite quickly, in many cases – as housing for workers, especially around Jericho and East Oxford.
Oxford then experienced a house-building boom through the early part of the 20th Century and particularly between 1930 and 1970.
What this means, of course, is that Oxford has a large number of older properties – extensive 1930s and post-war period housing estates, as well as significant pockets of Victorian and Edwardian rows, not to mention older period properties particularly around University buildings and the city centre.
Age alone is not the only reason to choose a specific survey – but it isn’t a bad one to base your thinking on. Never think that you are going too far. If you are anxious, it is best to feel as reassured as possible. The last thing you ever want to feel is buyer’s remorse.
A Final Word
A survey isn’t about scaring you off a purchase or giving you reasons to renegotiate the price. It’s about providing clarity and giving you confidence as a buyer, with a greater ability to make well-informed decisions.
Most properties have issues. Even newly built properties can have issues. The important thing is knowing what they are, how serious they might be, and whether you’re comfortable proceeding at the price you are paying.
If you’d like advice on which survey makes sense for a particular property, ask a surveyor – they aren’t there to oversell a survey, they are regulated and accountable professionals. We can recommend a surveyor to you if you are not sure.
Getting a survey can feel like an expense – but it could also turn out to be the best money you ever spent.
- Details
- Hits: 435

Last week we saw a headline that would have seemed pretty unthinkable just a few weeks ago: the UK government recorded its largest ever monthly budget surplus in January 2026, at £30.4 billion.
That’s the highest since records began in 1993.
Chancellor Rachel Reeves has been quick to present these figures as evidence of fiscal discipline taking hold. A success!
But much as we welcome genuine good news, before we get too carried away, we think it's worth looking more carefully at what is actually driving these numbers. Why? Because, when you examine the detail, a picture emerges: a significant portion of today’s record surplus has been built on the backs of property owners, home buyers, and the families of people who have spent decades building wealth through bricks and mortar.
Three particular property-relevant taxes tell much of the story – and all three therefore have a direct impact on the people we help buy and sell properties in and around Oxford – day in, day out.
Capital Gains Tax: A Headline in Need of Context
One number that has dominated the headlines is the Capital Gains Tax (CGT) taken in January 2026: around £17 billion. It sounds a lot – and it is – but when we see huge numbers like this we can easily shrug them off, for lack of context.
So, here’s some context: £17 billion is an increase of 69% on the same month last year. It is, as one analyst described it, “eye-popping”.
That said, if your first instinct is to picture this as evidence of a surge in second-home and buy-to-let sales – indicative of the landlord exodus, perhaps – there is yet more context to consider.
First of all, though, you would not be alone if that was what crossed your mind. CGT is a tax closely associated with property sales in the public imagination, and the rate rises announced in the October 2024 Budget (2024, not 2025), from 10% and 20% to 18% and 24%, certainly prompted many landlords and second property owners to consider their positions.
Nevertheless, the January figure is not primarily a property-related statistic.
CGT on residential property is generally (but not entirely) collected on a rolling basis throughout the year, because most sellers should report and pay within 60 days of completion. The January surge, by contrast, reflects receipts taken due to the self-assessment payment deadline of January 31 each year – the point at which CGT owed on shares, investment portfolios, and business assets from the entire tax year lands.
Much of this is likely to relate to asset sales as investors rushed to crystallise gains before a tax rise kicked in.
The genuine CGT story for property sales is nevertheless significant, however – it is just that, as yet, we don’t know what the full story will be.
We have indications, though.
HMRC data shows that in the 2024/25 tax year, 163,000 taxpayers filed a CGT on UK Property return, reporting 183,000 disposals with a total CGT liability of £2.2 billion.
Those were record figures, a year ago: the number of disposals was up 28% on the previous year, and the CGT liability itself rose 33%. But despite that record, it is likely we are watching it being broken again in real time.
The cumulative CGT already collected through the 60-day reporting mechanism between April 2025 and January 2026 stands at around £1.8 billion, with two months of the tax year still to run and be recorded. However, on top of what has been reported in rolling 60-day-from-completion payments, there will be additional property CGT still to arrive via self-assessment returns – there always is.
For these reasons, the 2025/26 figure will almost certainly exceed £2.2 billion when the final numbers are reported.
For the property market, the consequences are real and ongoing, and these CGT receipts are evidence of that. Landlords and second-home owners who might otherwise have continued to hold are being prompted to sell. That has direct implications for rental supply.
Higher tax receipts, yes, that does sound like good news; but at what cost?
Stamp Duty Land Tax: A Threshold Frozen in Time
The second property-related contributor to January's record surplus is SDLT. Homebuyers paid £899 million in stamp duty in January alone – a 6% increase on January 2025 – whilst across the full year, SDLT receipts reached £15.4 billion, up 18% on the £13 billion received the year before.
Now, we have to note that SDLT typically gets paid within 14 days of a sale completing, and hence – from those numbers above – we can see that it is very much a tax which sees receipts spread through the year.
That said, £899 million paid in one single month, and that being 6% up on the same time last year, is clearly still significant, and worth our time to take a deeper look at.
Partly, this increase in SDLT receipts is down to increased numbers of property sales. But that isn’t the full story.
Rather than signalling a large increase in transaction numbers alone, much of the increase actually stems from the reduction in the nil-rate band from £250,000 back to £125,000, which brought a wider range of transactions back into scope.
On top of this, first-time buyer nil-rate thresholds dropped from £425,000 to £300,000.
Let’s also remember that there is a deeper, more structural issue around Stamp Duty. Arbitrary as it might be, let’s pick a moment in time – say, the moment that the £125,000 threshold was introduced, back in December 2014.
The average UK property price then was £176,561. By December 2025, average sold prices had reached £270,259 – an increase of more than £93,000 on average. Here in Oxford, of course, things scale up significantly, based on our local averages: today, the Oxford average property sale prices, according to Dataloft, are £354,433 for flats and £597,594 for houses – and a combined average of £526,457. All of these averages are well above the lower stamp duty threshold and even the first-time buyer threshold.
In other words, buyers are not paying greater stamp duty not because they are purchasing larger or more valuable homes in any meaningful sense, but simply because prices have risen around them whilst SDLT thresholds have remained broadly the same – bar any temporary breaks or holidays, of which there have been a couple.
Calls for reform are growing. Coventry Building Society's analysis of the HMRC data prompted its head of intermediary relationships to describe the current threshold as one that "might have made sense in 2014, but house prices have moved on dramatically since then." (Did I say picking a 2014 date was arbitrary, earlier? Don’t you believe it.)
It is hard to disagree. Whether reform comes from the current government or forms part of the opposition's emerging platform, the case for updating thresholds to reflect today's market is becoming difficult to argue against.
Inheritance Tax: A Stealthy Expansion
The third strand of this story is perhaps the least visible, but it might be the most consequential for ordinary families. Inheritance Tax (IHT) receipts between April 2025 and January 2026 totalled £7.1 billion. That is up by £100 million on the same period last year. The Office for Budget Responsibility forecasts a full-year take of £9.1 billion, and this is a target the government is on course to meet.
Frozen nil-rate bands are doing much of the work here. As property values in parts of the country outside London and the South East have seen double-digit annual increases in recent years, families in the South West, the Midlands, and the North are finding themselves drawn into an IHT net that many would have thought well beyond anything they would have to concern themselves with, a few years ago.
In many cases, families find themselves drifting into an IHT liability without realising it.
The family home, often the single largest asset most people will ever own, is increasingly the mechanism through which IHT liability is generated – and we are seeing this play out in these record surplus tax receipts.
It is worth noting, too, that, under current proposals, from April 2027 pension assets will be brought within the scope of IHT – albeit this is still subject to legislation before it passes.
If it does transpire, it will mark a change that will further increase exposure for families who have done what successive governments told them to do and saved prudently.
Nevertheless, on this particular issue, it really is the property dimension which remains central.
A Surplus Built by Standing Still
Taken together, these three revenue streams paint a picture of a tax surplus that is, to a meaningful degree, a surplus shaped by property taxes – even if not entirely so, which of course it is not. Not in the month of January, which is the single month most bolstered by self-assessment tax settlements, bringing in revenues from self-employed income and the sales of non-property assets.
As always, when we bring ourselves to scratch beneath the surface of property taxes, it raises legitimate questions about sustainability.
The CGT surge, as we have noted, is likely a matter of timing and recording mechanism, rather than representative of a structural increase, and as it goes – whilst it has grabbed the headlines in the last week – it is probably the tax with less of a property-related contribution than the other two mentioned. That said, we can clearly see the property-relevant CGT element is significant, and that it is growing year on year.
More markedly, SDLT revenues are rising because thresholds have not kept pace with price rises, not because the market is fundamentally more active. In a similar way, IHT is creeping outward as frozen allowance thresholds get pipped by rising asset values.
At Cherry Picked Residential, we are not here to make political arguments. But we do believe that our clients – our sellers and landlords, homeowners planning for the future, and of course any buyers and future buyers we come to deal with – deserve to understand what is driving these numbers and what they mean in practice.
The record surplus is real, and there are ways in which this will spell good news for us all.
But there are questions worth asking too, particularly as the Spring Statement approaches on 3 March: is the tax architecture that produced this surplus fair? Is it sustainable? And is it fit for the property market as it actually exists today?
We'd be glad to hear your thoughts.
Q&A on the Record Tax Surplus and what it means for Homeowners in Oxford
Why did the UK run a record budget surplus in January 2026?
The UK’s £30.4 billion January 2026 surplus was mainly driven by self-assessment tax return payments, which featured higher tax receipts from capital gains tax (CGT) on financial assets. Nevertheless, CGT on property sales, as well as stamp duty land tax (SDLT) and inheritance tax (IHT) have contributed in January, from sales made in November, December and January, and IHT on deaths during the past six months.
How did Capital Gains Tax contribute to the surplus?
Capital Gains Tax receipts hit around £17 billion in January 2026, almost 70% higher than in the same month a year earlier. A large part of that came from investors crystallising gains on shares, portfolios and business assets before higher CGT rates took effect, but there is also a growing property element as more landlords and second‑home owners choose to sell rather than hold on.
Is the January CGT spike mainly about property sales?
No – the January spike is primarily about self‑assessment payments on gains made across the whole tax year, especially on financial assets. Property‑related CGT is usually paid on a rolling basis within 60 days of completion, so its receipts are more spread out, but as more landlords and second‑home owners exit, property is still playing a bigger supporting role than in the past.
Why are Stamp Duty receipts rising?
Stamp Duty receipts have risen because thresholds have moved against buyers, rather than because people are buying larger or more expensive homes. With the main nil‑rate band cut back to £125,000 and the first‑time buyer threshold reduced, more of each transaction is now caught by SDLT at today’s prices, especially in areas where values have marched on while bands have stood still.
How does frozen Stamp Duty policy affect buyers in Oxford?
In higher‑value parts of the country like Oxford, average prices are now far above the main SDLT thresholds, so many “ordinary” moves attract large up‑front tax bills. That makes it harder for growing families and upsizers to move, and slows the flow of properties through the market, even when people’s housing needs have changed.
Why are more families being pulled into Inheritance Tax?
More families are finding themselves within the scope of Inheritance Tax because the main allowances have been frozen while property values have risen year after year. As house prices outside London and the South East catch up, and as more of a family’s overall wealth is tied up in their home, it becomes easier for an estate to tip over the threshold without anyone feeling especially “wealthy”.
What role does property play in Inheritance Tax exposure?
For most people, their home is the single largest asset they own, so it often makes the difference between an estate being below or above the IHT threshold. As values have increased but the tax‑free bands have not, more of the typical family home’s value is now exposed to tax.
Are pensions going to be caught by Inheritance Tax as well?
Current policy plans point towards more pension wealth being brought within the scope of Inheritance Tax from April 2027, but we should note this is a proposal at this stage and as yet subject to final legislation.
Is this surplus sustainable for the housing market?
A large surplus built on frozen thresholds and lumpy, timing‑driven receipts is unlikely to be sustainable without side‑effects. If higher CGT, SDLT and IHT continue to come from people selling, buying and passing on homes, we can expect more pressure on rental supply, reduced mobility for buyers and trickier inheritance planning for families.
What does all this mean for homeowners, buyers and landlords locally?
For homeowners and landlords in areas like Oxford and across Oxforsdshire, these trends mean that tax is a more central part of every decision to buy, sell, let, or pass on property. Understanding how CGT, Stamp Duty and IHT interact with local prices can help you plan ahead, whether that is timing a sale, budgeting for a move, or thinking about how best to structure your affairs for the next generation.
- Details
- Hits: 769

Rightmove’s February House Price Index landed this week with a striking headline: property prices have effectively stood still this month. Nevertheless, thanks to the unusually strong uplift seen in January, we are still witnessing the strongest start to a year for asking prices since 2020.
This is a national picture, but it mirrors what we’re seeing on the ground here in Oxford.
In property market terms, Oxford remains in robust health. The market here – both residential sales and lettings – is demonstrating resilience amid a gradual national recovery, with early indicators pointing to stabilisation after some challenging months.
Rightmove’s data suggests buyers are optimistic but still a little cautious, with prices shooting up in January but flatlining this month. That said, sellers are holding their nerve – not dropping prices.
Locally, that same theme is playing out. Fewer dramatic swings, more measured decision-making, and a market that feels steadier than it did through much of 2025.
Local Market Performance
Recent data from the Office for National Statistics (ONS), compiled directly from Land Registry results, shows Oxford's average house price standing at £481,000 as of December 2025 (ONS data always lags by two or three months).
This is around the same value that properties had in December 2024 – which means no discernible price growth in 12 months in Oxford. This is something which, at face value, might give some local homeowners cause for worry.
Nevertheless, this performance mirrors the broader affordability pressures that have characterised the market since mortgage rates climbed sharply in 2023.
First-time buyers in Oxford – the type of buyer that we need to kickstart chain movements – are now paying an average of £412,000, again in line with first time purchasers in December 2024. Meanwhile, mortgage-backed purchases in general average £475,000.
That said, the market continues to show significant variation by property type. Detached homes are commanding an average of £972,000, whilst semi-detached properties are fetching £591,000, terraced houses £479,000, and flats £295,000.
Flats experienced the steepest correction during 2025, falling approximately 5%, whilst terraced houses proved more resilient with only minor price reductions.
One interesting trend we picked up on this month is that up to 31% of first-time buyers are delaying their purchases until they have a 25% deposit saved, per an article in The Intermediary, citing Moneyfacts data. A 25% deposit for first-time buyers; that equates to around £103,000 locally - not a small amount of money to save, and something that will usually take some time.
As such, it means there is a smaller number of first-time buyers available compared to years past, putting pressure on sellers to reduce prices to appeal to that limited pool, with that trend then repeating up the chain as a domino effect.
A flat-lining in value might concern some Oxford homeowners, but taken in context of wider South East performance, there’s reason to feel optimistic.
Pockets of London have seen falls of 15% and more over the past 12 months, although general drops are not so extreme, with much of the southern regions sitting around 5% drops.
Compared to the picture across the south, Oxford has held up well, and as national prices begin to improve, our local market is expected to recover steadily through 2026.
Local Success Stories
Despite the broader statistics, individual properties continue to outperform.
We recently exchanged on a property in Binswood Avenue, which we put up for sale in November, and on which we achieved £50,000 over the asking price.
This was after just two days of viewings, which saw twenty buyers through the door and six competing bids pushing the sale price from the £750,000 headline price, to an £800,000 sale – completing just two months later.
We know that presentation and marketing matter, and we certainly do put the effort in when it comes to these things.
Nevertheless, it’s also noticeable how buyer attitudes have shifted in this early New Year period compared with the hesitation that defined much of last year.
In these first three weeks of February alone, we’ve already had eleven properties go under offer.
If you’re considering selling, this feels like a genuinely promising moment.
Supply and Demand Dynamics
Oxford’s fundamental challenge remains its chronic housing shortage.
Green Belt restrictions and tight planning controls limit development here, in turn limiting supply, and that prevents significant price drops even when demand softens. This structural undersupply, combined with strong employment from the university sector and the city’s science and tech clusters, underpins long-term stability.
The rental market tells a similar story. Average monthly rents rose 6.5% last year, driven by sustained demand from students and professionals competing for limited stock.
The average monthly rent in Oxford now stands at £1,805 per month according to the ONS.
Looking Forward
Rightmove’s February data points to a market finding its footing – steep asking price rises in January, and a bit of calmness this month to settle things down.
Locally, we’re seeing something similar in terms of sentiment, even if the asking price pattern hasn’t quite matched here month by month.
Relatively stable mortgage rates, pent-up demand from postponed movers, inflation just reported to have come down to its lowest level in months, dropping from 3.4% in December to now sit at 3% - and combined with all this, Oxford’s enduring supply constraints.
These things all combine to support a forecast of gradual improvement – albeit probably not dramatic swings.
For sellers, realistic pricing remains essential. For buyers, affordability is improving, but thoughtful decision-making still matters.
The outlook for Oxford’s property market in 2026 is one of measured optimism: steady growth, improving confidence, and fundamentals that remain amongst the strongest in the country.
If you’re considering a move and would like honest advice on where your property sits within today’s market, please get in touch for a no-obligation chat.
- Details
- Hits: 413

Half Terms and House Prices: An Oxford Market Update
It’s the February half-term holiday, 2026 – and that means ‘busy’.
You just know that Little Sprouts at Millets Farm will be will be enjoying packed crowds of (very) excited children, the Ignite Sport holiday camps at Oxford City FC and the North Oxford Tennis Club will be in full swing, and if you head down to Hinksey or Cutteslowe Parks, you’ll find that, despite the endless drizzle, the children’s play areas, football pitches and cafés will all be absolutely full of life (and indeed, are those blue skies we see today, at last? Or trying hard to be seen, at least!).
Nevertheless, if you’re currently selling your home in Oxford, can you expect things to feel as busy? Or is February half-term one of those quieter periods, like the Easter break can be, and like the Summer and Christmas holidays almost always are?
Here are our thoughts as independent local estate agents in Oxford.
What’s happening in the property market?
There is good news as we hit the February half-term break. In bigger picture terms, the property market is broadly positive.
House prices continued their upward trend in January, with Halifax reporting rising UK property values – and, notably, that they have risen above £300,000 for the first time, reaching £300,077 in January on a 12-month average, per the Halifax Price Index.
Here’s what else the Halifax Index in January 2026 has shown:
- Monthly Change +0.7%
- Quarterly +0.1%
- Annual Change +1.0%
What is interesting about their figures is that average UK property prices rose from £239,253 in January 2020 to reach £300,077 in January 2026 – an increase of just over 25% in six years.
Also noteworthy is that the price increase from 2020 to 2023 was 18.7%, compared with the 5.7% increase from 2023 to 2026.
Growth in the past three years, yes; but much more muted than those previous three – and certainly behind inflation. This is perhaps a sign that prices that had risen too quickly in the immediate post-Covid years are correcting course.
At the same time, last week’s vote by the Bank of England’s Monetary Policy Committee was closer than many expected, reflecting ongoing concerns about subdued economic performance.
This may not be great news for the wider economy, but it does, in our view, reopen the possibility of a base rate cut in March, which markets had begun to discount.
Fixed mortgage rates have been edging up again recently, just slightly, following the pattern of swap rates, which had suggested the market was pricing in no further near-term cuts.
Perhaps that tension is playing on rate setters’ minds.
For local buyers and sellers, this matters. In higher property-price areas like ours, affordability does tend to tighten more quickly when mortgage rates rise, so you can be sure we’ll be keeping a very close eye on it and how it affects you locally.
Which brings us tidily to what probably matters more to you: never mind the national picture, what about the property market and property prices in Oxford?
The Oxford property market is strong despite a flat line in property prices
Here in Oxford, at the time of writing, the average property price over 12 months stands at £491,000, roughly the same as it was a year ago, according to the Office for National Statistics (ONS). And that is positive, because it was not long ago that we were seeing rolling 12-month price drops of 3%, 4%, or even more, at various points over the past year.
Prices may have flatlined on paper – but the reality is, they have improved, from an annual reduction to, now, a levelling off; and that is not the same story throughout the South East of England, where property values in some places still sit at double-digit drops over the course of the last 12 months – especially in parts of London.
This is the context we need to consider when discussing your move locally, whether you’re selling, buying, or simply keeping tabs on your home’s value.
It shows that what is reported in national news headlines or revealed by national indices can differ from the pictures seen in any local or regional marketplace. The national price indices we get from Halifax, Nationwide, or even Rightmove can paint a broad-brush picture, but there can be quite extreme regional variance. In particular, during 2025, the London, South East and East of England markets have been much more subdued, price-wise, than markets in the North of England and the Midlands.
The fact that prices in Oxford are roughly level with where they were a year ago, therefore, compared to drops of 5% to 7% quite commonly across the South and East of the country, and as much as 15% in some parts of London, speaks volumes about the strength of our local market and the desirability of Oxford as a destination for movers. In addition to property values, we have seen rents in Oxford increase by 6.6% over the year, according to ONS data.
Nevertheless, house prices alone don’t necessarily indicate whether a market is moving in a positive direction.
When you look at that general 25% increase over six years, you can understand that properties in general have plenty of equity in them.
In fact, whether we have seen a flatline in values over 12 months, or we were still looking at the 3-4% drops that have felt normal for much of the last 8 months or so, the overall growth we have seen here over not just the past six years, but even many decades, has been so significant that local sellers can afford to take a reduction this year and still make a comfortable move – especially if they are moving locally or to many locations overseas, where sale proceeds may convert favourably on current currency exchange rates.
Most people understand that values are relative. As long as there isn’t a negative equity situation, most movers can think of it as transferring equity from one property to another.
In other words, even if a seller had lost some value in their home this year, if the property they are purchasing had also lost a similar value, there would usually be no financial reason the move couldn’t proceed.
It may depend on mortgage rates, which is why what the MPC votes to do next month is of interest, but generally speaking, it is much more a matter of market confidence.
And that is where the local market is showing real strength, despite anything that prices may or may not have done over the past year – and why this February half-term holiday is still likely to feel busy out there in terms of property market activity.
Plenty of choice for buyers
If you are moving home locally, there are definitely encouraging signs that the Oxford market is coming to life as we hit the half-term break.
At the time of writing, Rightmove shows 204 new listings in Oxford over the past two weeks alone, with 960 properties currently for sale overall. This is a healthy level of choice for buyers in general, but that two-week number, in particular, is another sign of steady and positive market activity.
But will the February half-term holiday week dampen that rising activity? As mentioned, other holiday periods are known to have that stifling effect on property market activity – Christmas and Summer in particular. But historically, this half-term week in February does not tend to have that same effect.
There will be a bit of holiday-making going on, for sure – particularly amongst the skiers out there – but most people do stay at home, perhaps with children off school, but nevertheless not so distracted from life as they often are during those other major holidays.
On top of this, the property market itself is still in that active phase following the post-Christmas/early New Year bounce that we have written about previously (see article here); those who put their Oxford property for sale as part of a ‘New Year’s Resolutions’ drive in early January are starting to go under offer in numbers by around this point, five or six weeks later – and many of them are purchasing another property to move to. This only adds to the swelling number of active buyers who begin their search at around this time, with the idea of a Springtime or early summer move in mind.
So, with listing numbers growing, but competition from other buyers also increasing, if you are buying a property in Oxford right now, it pays to have a plan.
If you’re moving home, clarity is your friend
If you are heading out to view properties this half-term, our strongest piece of advice is to get crystal clear on what you need, what you want (as these can be different), and the reasons you might truly want to be in one particular location rather than another – schools, transport, recreation grounds, bus-gates, hospitals, or whatever else it may be.
That matters far more than the pretty pictures you’ll scroll through online. Those can draw you in – but knowing ‘what, where and why’ helps us as professional estate agents truly get to grips with what will work for you, and what could be made to work.
You want four bedrooms because you want one of those for a dedicated study? You might be missing out on an ideal home with only three bedrooms, that nevertheless has a perfectly sized shed at the end of the garden that could be easily converted.
This is why talking through your requirements with a professional is a good first step. It doesn’t mean any obligation, but from our point of view as agents, it means we can be on the lookout for the right property when we are invited to meet potential sellers.
As we can see, the market is picking up, and we are optimistic, with a good level of choice available to Oxford buyers. But finding the right property isn’t a tick-box exercise. It’s about finding somewhere that genuinely fits your next chapter – and that is what we want to help people achieve.
