


-
Home

- Blog
Latest news and information
- Details
- Hits: 391

TL;DR: Mortgage product availability has hit a two‑year low, fixed rates are rising at their fastest pace in years, and the average deal is now being pulled off the shelf in just eight days. But before you panic, here is what the data really tells us – and why, if you’re looking to move home, there are still reasons for calm pragmatism and cautious optimism.
A Record Nobody Needed to See Broken
The Moneyfacts Compare Treasury Report shows that a new record has been set in the mortgage market. The trouble is, it is not one lenders, buyers, or homeowners will be particularly thrilled about.
But first, some context. Cast your minds back to the autumn of 2022.
The Truss–Kwarteng mini‑budget had just sent shockwaves through financial markets. Mortgage products were pulled almost overnight as swap rates spiked, leaving buyers and homeowners facing a rapidly shifting lending landscape.
At the time, the average mortgage ‘shelf life’ – the number of days a lender keeps a mortgage deal available before withdrawing or repricing it – slipped to 15 days. By summer 2023, as inflation surged, this dropped further, to just 12 days.
It was a crisis-driven anomaly. As the market gradually stabilised over the following two to three years, product availability improved and those ‘shelf lives’ lengthened.
But in March 2026, a new record was set.
According to the Moneyfacts UK Mortgage Trends Treasury Report, the average shelf life of a mortgage product has now fallen to just eight days, beating that 12-day record set in 2023 – and in fact, the shortest since records began in November 2011.
In practical terms, it means lenders are repricing their entire product range almost weekly. When markets are stable, lenders leave products available for longer. When uncertainty increases, particularly around inflation and interest rates, lenders move more quickly to manage risk.
An eight‑day shelf life is not a sign of panic, exactly. If anything, it might be a sign of confusion. But overall, the signal it sends is that lenders are cautious.
- Details
- Hits: 600

The headline may come as a surprise.
On 26 March, 2026, the Office for National Statistics (ONS) released its Housing Affordability in England and Wales: 2025 report, and several outlets – not least the venerable Financial Times – led with that sort of apparently upbeat headline: property is at its most affordable since 2015.
Homeownership sometimes feels like a goal balanced on the edge of an ever-receding horizon, so this probably comes as genuinely good, if possibly surprising, news for many people.
But as is so often the case, the headline tells only part of the story, and there is nuance in the numbers. Dig into those, and a more complicated picture emerges – one that deserves a closer look before we declare the housing crisis solved.
The method behind the maths
The ONS measures housing affordability using a ratio: the median average property price divided by the median annual earnings of full-time workers.
In 2025, the median sale price for a home in England stood at £300,000, against median annual earnings of £39,300. This gives an affordability ratio of 7.6 – i.e. the median property value was 7.6 times greater than the median annual full-time income.
And it is this figure that is down – down from 7.8 in 2024, and the lowest it has been since 2015.
Falling property prices is not the cause. In fact, median property values have risen around 5% since 2021 alone. What has brought affordability closer is wages: median earnings have grown by 25% over the same period, closing the gap between income and property prices.
In simple terms, this represents genuine progress. At the peak of 2021, the property value-to-income ratio in England hit levels that risked locking out a generation. The direction of travel has meaningfully reversed from that point.
And some parts of the country are again now back below the ONS's own affordability threshold of ‘five times earnings’. Hyndburn in Lancashire and Kingston upon Hull both came in at a ratio of 4.1 in 2025 – and therefore technically "affordable" by this measure. The North East as a whole sits at 5.0 times.
Nationally speaking, the numbers might lead us towards cautious optimism. The ONS itself notes that the number of local authority areas with a ratio above 12 – the most acutely unaffordable tier – has more than halved since 2021, when it stood at 76 areas (it is now at 33). Oxford has famously sat there in recent years – at one point broadcast in the press as being the most unaffordable city in the UK, when it hit
17 times average incomes, although research shows it was more likely at 15 times. Still, very high.
Not the highest of all areas, though. For context, Kensington and Chelsea, as part of Greater London, remains the outlier nationally, with property values at 25.2 times local average incomes. Even that is down sharply from a peak of 44 times income reported by outlets there in 2018, however.
Structurally speaking, we might look at all this with a sense of growing relief, seeing that the worst of the distortion is easing.
Why, then, this sense of doubt you can no doubt feel creeping through my narrative today?
Let’s explore a little further.
There is more to affordability than price-to-income ratios
The ONS headline from 26 March 2026 tells us something about the state of the market – but it soon starts to fray at the edges, if not unravel completely, when you start to pick at it.
Why? Because the ONS ratio compares house prices to gross earnings. What it does not – and truthfully, cannot – account for is what has happened to the actual cost of buying and owning a home in the intervening years, particularly in the face of general costs of living.
Consider mortgage rates.
In 2021, when the affordability ratio was stretched to its widest point, the average two-year fixed mortgage rate in the UK sat at around 2.5%. By late 2023, it had surged above 6%. This has been largely attributed to the fallout from the mini-budget under Truss/Kwarteng, but there were other structural pressures at the time.
Those rates, soaring as they did as the Bank of England base rate chased inflation upwards, had a stifling effect on property price rises, but at the same time, they brought obvious challenges for households when it came to disposable income.
These rates have come down since, increasingly so through the last few months, and as we entered 2026, all the talk had been of the Bank of England base rate likely to fall further throughout the year, bringing mortgage rates down accordingly.
Recent events have changed this narrative, and as is well documented, we have witnessed average mortgage rates climb.
A buyer purchasing a £300,000 home today with a 10% deposit, on a 25-year repayment mortgage at 4.5%, now faces monthly repayments in the region of £1,500. The same purchase at 2020's rates would have cost closer to £1,100 a month. And of course, at the moment, mortgage products are changing quite quickly, with those rates now heading up to an average of more like 5% or a little over.
What does this mean in practice? It means that whilst the affordability ratio may be falling, the actual monthly outgoing is not, and whilst wages have risen in the meantime, we have to recognise that other costs of living have also increased.
This is the problem posed by taking the ONS affordability methodology in isolation. It is useful, and it can be headline-grabbing, but it does not model what a buyer actually feels in their back pocket, nor what they pay each month to service debt.
An improving affordability ratio in an environment of structurally higher rates can and often will be misleading. The gap between salary and house prices may have narrowed, but the gap between salary and the cost of living more broadly has kept pace or widened.
Inflation, even having retreated from its 2022 peak, has permanently repriced a wide basket of everyday goods and services. Groceries, energy, insurance and childcare have all risen substantially faster than wages at various points in the last four years. The 25% earnings growth that the ONS credits with improving affordability ratios has, for many households, been absorbed by higher day-to-day costs.
In short, real disposable income tells a less flattering story than gross median wages.
There is also a broader geopolitical context that the data, collected in 2025, is only just beginning to reflect. Conflict in the Middle East and continued war in Ukraine, is causing geopolitical tension and uncertainty, energy price volatility and problems with international trade that impact us all. The recalibration of global supply chains continues to create headwinds that impact the economy, and naturally this feeds through to impact consumer confidence.
Which prompts an obvious question: how is consumer confidence here in Oxford?
Measured optimism for the Oxford property market
Despite all of the above – the affordability pressures, rising mortgage rates, interest rate predictions heading into reverse, and an expectation for potentially rocky weeks ahead – none of this is to say that the market is stagnant or that buyers should sit on their hands.
In fact, quite the opposite. Several data points suggest that activity and sentiment are holding up better than the outward noise would suggest.
HMRC transaction figures showed a 6% uplift in residential property sales between January and February of this year, a meaningful step-up in activity at a time of year when the market is traditionally finding its feet, and indeed a bigger jump than in other recent years.
Numbers of new instructions – that is to say, properties being newly listed for sale – have increased significantly over the first quarter of the year in 2026, with 1,684 properties currently for sale in Oxford, up from 1,469 in December, and 16% higher than at the same time last year (per Dataloft figures).
It all suggests that sellers are sufficiently keen to commit, in a way that wasn’t matched through much of last year and 2024.
Supply is high and demand is increasing. As we head into the Easter period, traditionally a time of year that sets off a busier period for the property market, this is a healthy signal.
Mortgage rates have edged upwards in recent weeks, as mentioned, but so far this has not materially dampened activity. Lender appetite remains strong, and the product landscape has diversified considerably. Back in 2023, it looked like thin pickings by comparison. So, whilst the mortgage market is not quite as attractive as it might have been four or five weeks ago, the well is definitely not dry by historic measures.
At ground level, sentiment is, by and large, positive. A little cautious maybe, and with half an eye on news headlines, but overall there seems to be a sense out there amongst local Oxford people that, until there is a reason not to, they should continue to move home – just as they should continue to go to work, go shopping and go on holiday.
The picture, in short, is one of a market that is functioning, adjusting, and in some respects even improving – but to us as local Oxford estate agents, we feel it is important to recognise that the improvement is more nuanced than the ONS headlines alone convey.
Our job as Oxford estate agents is to successfully navigate the home moving process for our buyers and sellers – and this is why it is so crucial to be honest about the state of the market, and to keep a watch on it as things change or, equally, settle down, which we can still hope will happen within the next few weeks.
What is happening in the local Oxford Property Market
Payscale, a leading market intelligence group specialising in income data, puts Oxford’s average income at £39,000 – not very far away from the £39,300 national average income noted by the ONS.
At the same time, the average property value stands at approximately £478,595 according to Dataloft analysis – well over 50% higher than the national average of £300,000 noted by the ONS.
It produces an affordability ratio of over 12.2 times income.
An improvement on 15 times, as recorded in previous years! But nevertheless, higher than the 7.6 national average, and still enough to place Oxford as one of the 33 districts deemed most unaffordable in the country.
In a tightening market, this matters. Local buyers are likely to feel mortgage rate changes more keenly as the general cost of living impacts people locally more so than other parts, especially when house prices are so much further ahead than national averages at the same time.
It means that local buyers have a little more to consider when deciding how much to budget each month for things like mortgages, deposit savings, and other expenses.
That said, all this does not mean the market is weakening at this stage. In fact, activity levels have held up well. Transaction figures have risen in early 2026, more properties are coming to market, and buyer demand remains steady. The market is functioning – but buyers in the market right now are also becoming more selective.
This is particularly important for sellers to take on board – and especially when setting asking prices. With local affordability stretched in real terms, properties priced too ambitiously are more likely to stagnate.
Buyers remain active, right now, and we are working with plenty at the moment who are ready to purchase and eager to come out viewing; that does not mean that they aren’t also cautious and price-conscious.
The encouraging news is that well-priced homes are still achieving strong results, often within reasonable timeframes – with time on market dropping in the first three months of 2026, from 61 days on the market in December 2025, to 47 days on market by March 2026.
The local market remains fundamentally strong – but when it comes to getting your home sold, in tighter, less certain markets, strategy matters.
If you’re considering moving in 2026, understanding these nuances is key. The headlines suggest improving affordability, but the reality is more complex. That doesn’t mean being defeatist – but recognising the shape of things allows us to build the right strategy for our clients when selling their homes. Navigating the complexity of the market is where local expertise becomes invaluable.
If you’d like to discuss what these trends mean for your property, we’d be delighted to help. Contact us here at Cherry Picked Residential in Oxford, for an honest but pragmatic discussion about getting you moved successfully in 2026.
- Details
- Hits: 2626

It was the first day of Spring last week, Friday 20 March 2026. And we all know that Spring is ‘the best time of year’ to sell your home? Right?
Actually, no, not necessarily.
It is, however, often the busiest time of the year for property transactions and sees a steep rise in the number of new properties listed for sale. As a result, it can all feel very buoyant. And Spring is certainly not a bad time to sell.
If you own a home in Oxford and you’re wondering whether to sell in spring 2026, this article will help you decide.
After a sluggish end to 2025, activity is picking up, and the headlines look encouraging.
We know, for example, that properties currently advertised on the market for sale are at their highest level for a Spring market since 2015 (Dataloft), and that property values are possibly at their highest level ever: the average UK property price is now around £301,000, according to the Halifax, breaking through the £300,000 mark for the first time – although other sources, not least the Office for National Statistics, vary (the ONS has it closer to £270,000).
No matter the national headlines, however, it's worth understanding what's really going on in the market right now, and especially what is going on here in Oxford – because the property market picture is often more nuanced than it first appears.
More Homes for Sale in Oxford
There are certainly similarities between the national picture and the local Oxford market when it comes to reading the data.
One interesting statistic that jumps out is that estate agents started 2026 with an average of 32 homes for sale, the highest level in early January since 2018 and thank you to Garrington, the home search specialist, for the information. That marks a significant shift from the supply-starved market of previous years – and in many ways, supply-starved markets are the sort of markets sellers particularly enjoy.
It indicates an overall picture of more properties becoming available for sale following the Autumn Budget on 26 November 2025 – an event that stalled the market in the weeks running up to it, slowing down new listing numbers and transactions.
The growth in homes listing for sale is greatest in London, up 16% on last year; the South East in general, which Oxford tends to fall into as a region, is up by 9%.
But Oxford actually shows a similar trend to London, with the number of new properties for sale up by 14% compared to 2025.
In fact, there have been 3,457 properties come up for sale in Oxford over the past 12 months, with 1,471 available today (as of 23 March 2026) – and as far as choice goes, 20.4% more properties available to choose from this year than last year, and that is city-wide – as true in Headington as it is in New Hinksey.
Property prices, too, are higher than the national average- £477,276, according to data compiled by Dataloft, drawing on Land Registry figures – and are within 0.5% of prices this time last year.
However, transaction numbers have fallen steeply over the past twelve months. There have been 1,265 property sales over the year, a 25% fall on the year before.
Figures and percentages don’t mean anything on their own, but it is important to talk about them and understand the context. Why? Because what it means, when brought together, is that buyers in Oxford have more choice – and they know it.
Buyers are Back, but Buyer Behaviour is More Cautious
Falling transaction numbers can read like bad news, but it isn’t necessarily. The wheels didn’t come off the market locally, simply because transaction levels fell, but with listing numbers increasing at the same time, especially post-Budget 2025, it does lead to this situation we are looking at as we enter the Spring – i.e. that property for sale is at a high. And that has meant many sellers remaining on the market longer than normal – those sold in February 2026 had been on the market for an average of 46 days, which is 9.6% longer than a year ago. It is partly why property prices have remained relatively flat over the year.
The good news for sellers is that buyer demand has also rebounded over recent weeks. Buyer registration numbers have remained sustained – and our own sale numbers are beginning to increase – 12 sales agreed during February, and we look like hitting a similar number this month, with one week to go. But that ‘time on market’ figure is important to note – as until that starts falling, it indicates that whilst buyers numbers are rising again to meet demand, they are nevertheless behaving more cautiously, taking their time to make decisions, perhaps third-viewing or even fourth-viewing before making decisions, and probably viewing more properties than during previous years, as there is simply more available to them to view.
On top of this, the wider market situation might play on minds. The mortgage picture has shifted sharply this month, with rates rising in response to geopolitical events. The outlook for rates and where they might go has become a little uncertain. Anyone planning to buy or sell where there is a mortgage involved should certainly speak to an independent mortgage adviser sooner rather than later.
When we note Oxford’s homeownership demographic, and that 45% of homeowners have a mortgage, we can appreciate that this is an issue that will come into the planning and thought process of a large number of would-be movers right now.
What This Means If You're Thinking of Selling
The spring market of 2026 is one of opportunity – but with the market picture as it is, with stock levels high, property prices evidently steady but not rising, and with the marketing period taking almost 10% longer before securing a buyer than in the past, it is important that sellers – and their estate agents – approach the process with clear eyes and a smart strategy.
Properties that need price reductions take 2.4 times longer to sell than those that were correctly priced to begin with – and, crucially, those sales then have a higher chance of falling through. It's why we take the process as seriously as we do when we initially advise our clients, before marketing even begins.
The fundamentals here in Oxford, however, remain positive, which means that well-marketed, sensibly priced homes are still selling quickly. Medium-term forecasts do point to stronger price growth through to 2030, despite current economic headwinds, which, as headwinds do, will eventually blow through.
Sellers who act in 2026 are well placed to benefit from improving conditions as we head into the Easter period and the spring market that follows.
We believe it is key to work with an agent who understands the local market intimately and in depth and detail, and who benefits from day-to-day experience working within it. National headlines can guide us, but analysing local market activity at a more granular level helps us build the right strategy to get local Oxford homeowners moving. In this market, more than ever, success will be dictated by hyper-local awareness and a tailored sales strategy.
= = =
Are you ready to find out what your home is worth in today's market? Get in touch for a free, no-obligation valuation and honest, data-led advice on the right strategy for your sale.
- Details
- Hits: 310
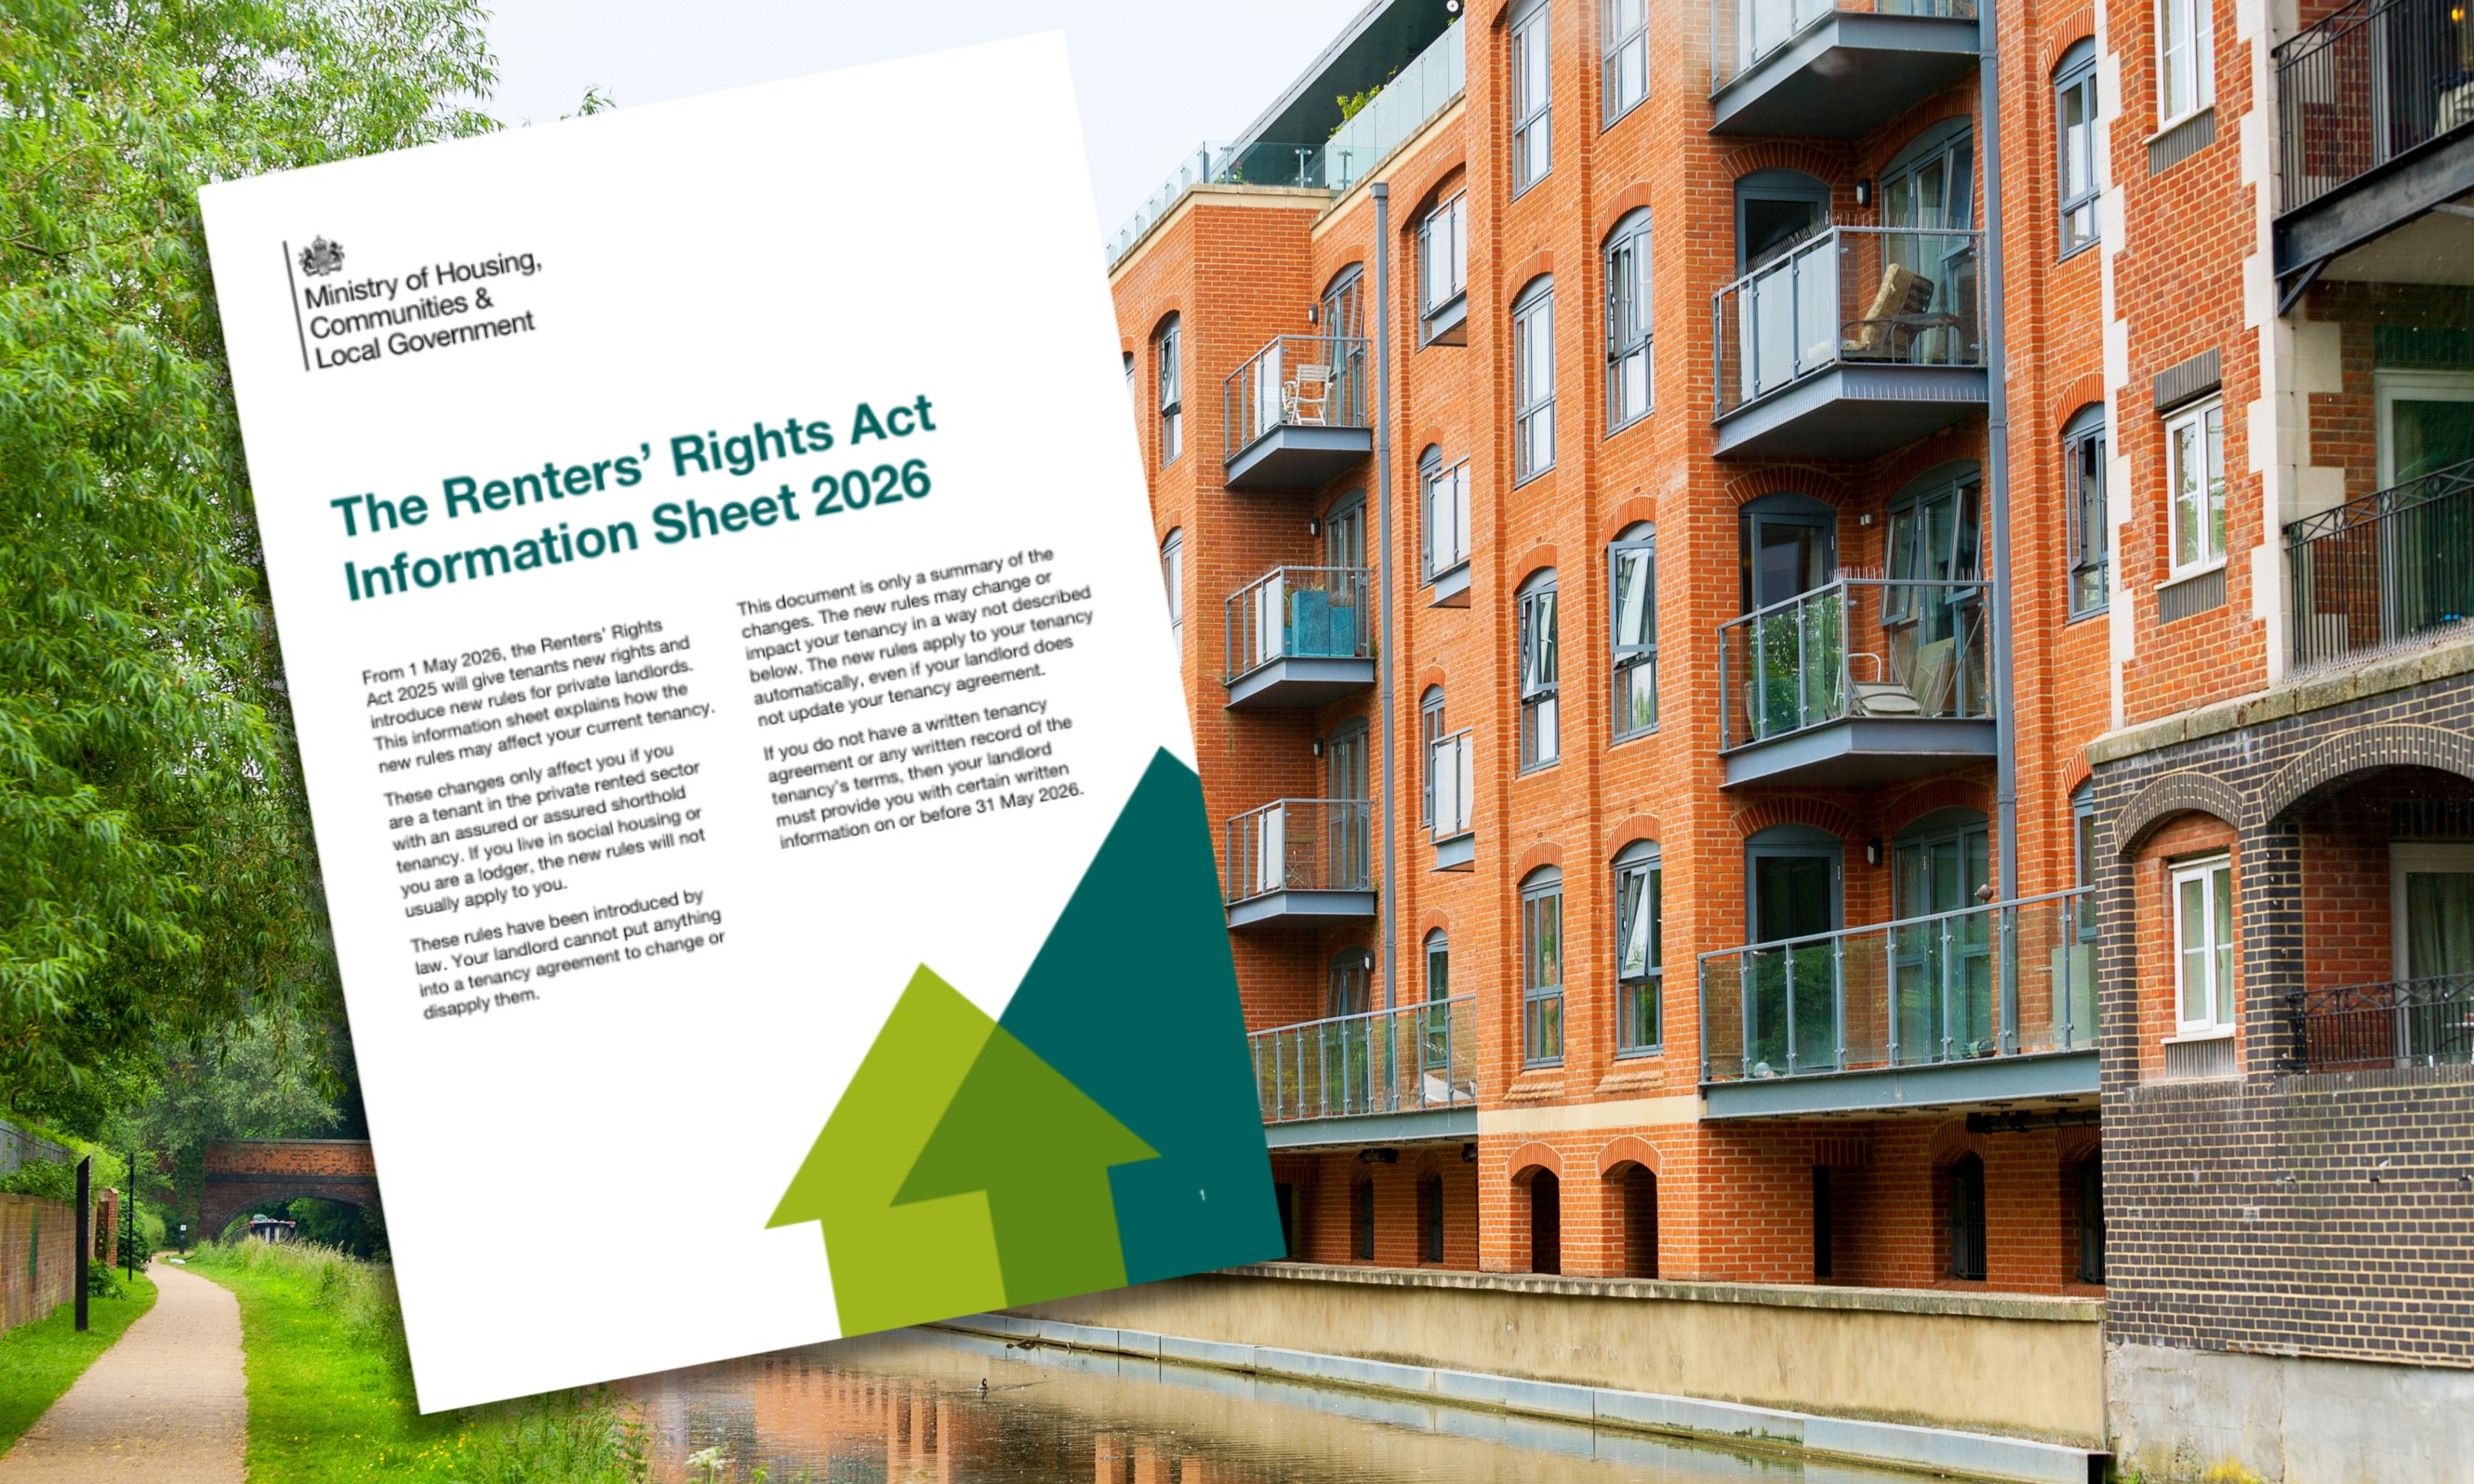
Did you miss it?
If you’re a residential landlord, letting a property out to tenants, there’s something you might have missed this morning (and you can be forgiven if you did!).
The government has just released the official Renters' Rights Act Information Sheet for Tenants – but it is important to take note as it comes with a legal obligation attached.
The Information Sheet has been something we’ve been aware of and waiting for. Its aim is to explain to tenants how tenancies may be affected by the changes introduced by the Renters' Rights Act 2025, and landlords with existing tenancies are required to provide tenants with a copy on or before 31 May 2026.
So what's actually in it? In all honesty, the sheet itself is fairly light-touch – just a brief overview of the headline changes rather than an in-depth guide. Tenants shouldn’t expect it to answer every question they might have about the new legislation.
That said, the length and depth of it doesn’t necessarily matter, when it comes to landlords complying with the Act. It is a legal requirement to send this document to tenants, not a courtesy, and the consequences of missing the deadline are significant. Failure to serve it can result in a civil penalty of up to £7,000 per breach, and in fact continued non-compliance could escalate to fines of up to £40,000 or even criminal prosecution.
If your property is managed by us here at Cherry Picked Residential, you don't need to worry. We're on top of this and will be ensuring the Information Sheet is issued to all tenants on your behalf well within the required timeframe. It's exactly the kind of detail that can slip through the cracks when you're managing a portfolio — which is precisely why having a managing agent in your corner matters.
If you're a self-managing landlord – even if you let your property through an agent on a ‘let-only basis’ – the responsibility sits with you. You may have used an agent to find a tenant, but that doesn't transfer this obligation. We are speaking to many self-managing landlords currently, who are enquiring about our management services, so if you are worried about legislation like this catching you out, please get in touch to find out how our managed service can take all those worries away.
If you do need to know how to find the Information Sheet, it is available now on GOV.UK and you can download it directly here: Download the Renters' Rights Act Information Sheet
Don't leave it until the last minute… 31 May will come around quickly!
- Details
- Hits: 594

March 19, 2026
The Monetary Policy Committee has voted to hold the Bank of England Base Rate at 3.75%. This was not a surprise. But before anyone rushes to write this up as an economic setback, it is worth noting that the property market itself remains in better shape than headlines suggest.
* * *
Just a month ago, there was very little question whether rates would fall at this meeting – it was more a case of pondering how many more times they might be cut this year.
Inflation was retreating faster than most economists had forecast. Energy prices had eased. Food prices were starting to come down. On the housing front, mortgage rates were dropping sharply as swap rates fell, and sub 4% deals were becoming widely available. Confidence was visibly returning.
Rightmove reported the largest jump in asking prices for the month of January in its 25 years of tracking the market – a 2.8% rise, equivalent to nearly £10,000 on the average UK home, the average value of which rose beyond £300,000 for the first time in history according to the Halifax Index – albeit, sold price data from the ONS was more reserved, showing average property values of sold properties to be at just over £273,000.
In any case, the mood was becoming cautiously optimistic. Not euphoric; in many ways, the market has learned its lessons. Nevertheless, the general market outlook seemed measurably better. The trajectory felt clear.
Then geopolitics intervened.
________________________________________
How We Got Here
Conflict in the Middle East has sent oil and gas prices sharply higher over recent weeks. Energy costs, which had been one of the good-news stories in the inflation picture, have quickly swung in the wrong direction again.
This has all fed directly into the forecasts that the Monetary Policy Committee uses to make its decisions, forecasts which have therefore changed materially between the February meeting and today's.
The result of today’s vote was predictable, and financial markets had anticipated it. By the beginning of this week, the implied probability of a rate hold had risen to around 80% - almost the opposite of where odds for a cut had been around four weeks previously. This hold was, in the language of traders, ‘nailed on’ – and so the conversations we have been having with movers over the past three weeks has reflected this expectation.
Swap rates, which underpin the fixed-rate mortgages that most buyers and landlords rely on, had already headed up, and so lenders began repricing.
Moneyfactscompare.co.uk reported earlier this week that the average shelf life of mortgage products has dropped to just 14 days, as lenders have scrambled to reprice ahead of further uncertainty. A further announcement from Moneyfacts just a day or two later has suggested that 4% mortgage deals are set to disappear from the market entirely. In fact, property data site Dataloft has reported that average 5-year fixed mortgage rates are already back to 4% and inching upwards.
So yes – in line with the narrative we have seen building over the past three to four weeks, base rate cuts were held on Thursday 19 March, 2026. A consequence of global events outside anyone's control, priced in before the MPC cast its votes.
________________________________________
The Message for Homeowners and Landlords in Oxford
Despite the economic headwinds the country is facing, there is an important message to still underline: the fundamentals of the property market remain robust.
When this sort of geopolitical tensions, energy price shocks and mortgage market caution come together, it is natural to feel uncertain. But the data we are seeing in the property market tells a story that the headlines are not.
New listings – that is to say, properties being brought to market for sale – are running at almost exactly the same level as 2025 on a year-to-date basis. That comparison is notable because 2025's first quarter was unusually active, driven by buyers and sellers aiming to capitalise on demand ahead of the stamp duty holiday deadline, which was expiring on March 31, 2025.
If we strip out that distortion, the picture becomes even more striking: new listings are running 9% ahead of the same point in 2024, and approximately 20% above the 2017-2019 pre-pandemic average. Confidence in the market has been strong and remains intact.
Transaction volumes tell the same story. Over 220,000 sales have already been agreed across the UK this year. Against 2024, that is 9% higher. Against the 2017-2019 pre-pandemic average, it is 18% higher. These are not the numbers of a market in distress, and even if there has been some caution brought in by recent events and mortgage market hardening, the overall sentiment is still currently positive, and as a whole, that sentiment won’t change quickly.
________________________________________
What About Mortgage Rates?
This is a legitimate concern that shouldn’t be dismissed. The repricing of mortgage products is real, and we are witnessing it happening in real time. Borrowers coming to the end of fixed terms in the next few months will face a different landscape than they had probably been looking forward to, hoping to benefit from the rate-cutting cycle that appeared to be accelerating earlier in the year.
But perspective matters. Rates are not showing signs of returning to the peaks of late 2022 and 2023 at this stage. The Base Rate remains at 3.75%, 75 points lower than it was twelve months ago.
The direction of downward travel has been disrupted, undeniably, but it has not reversed permanently. Most credible forecasters still expect cuts over the course of this year, albeit on a slower timeline than was anticipated in January.
For buyers who can be flexible on timing, perhaps there is some reason to be patient.
But – and it is a significant ‘but’ – it is important to remember how much better rates are today than they were eighteen months ago. For those who do wish to move now, and certainly anyone who needs to move, the mortgage products now available – even repriced products – are considerably more affordable than what was on offer then.
________________________________________
Our View
The property market story in 2026 is not yet written. That said, the opening chapters are much better than the mood music might suggest. Rightmove data, recorded transaction figures, the volume of new instructions… these are not the statistics of a market that has lost its nerve.
Global uncertainty does become an active, almost tangible modifier of markets, and the immediate impact on mortgage pricing is evident. Nevertheless, the desire of people to buy, sell, and let property in this country is equally real — and the numbers show it has not gone away – swelling, in fact, after a depressed second half of 2025, caused largely by uncertainty over what was coming in the Autumn Budget.
________________________________________
What Next for the Property Market?
The groundswell of activity seen in the early part of this year means the market enters this period of uncertainty from a position of genuine strength. That is important. It means the wheels are not showing signs of being likely to come off.
But it would be naïve to pretend that economic conditions will not become trickier in the months ahead, and those thinking of selling should of course factor that into their thinking – particularly if they themselves are under financial pressure. On the other hand, sometimes moving home is the solution to relieve financial pressure, and there is every reason to still look at this as a viable option – because there are certainly buyers for your home out there.
Vendors do need to be thoughtful about asking prices. Over-ambition at the point of listing is the surest way to watch a property sit on the market as buyer confidence wavers. Buyers remain active – our own numbers confirm that, even before we turn to Dataloft for analytics. That said, they are discerning, and a price that feels out of step with the market will simply be ignored.
What history tells us, though, is that people will carry on moving. People carried on moving after the 2022 mini-budget. They carried on moving through the upheaval of Covid. They even carried on moving in the aftermath of the 2008 financial crash. Momentum may slow, but it does not stop, and we fully expect this year to see well over a million sales agreed across the UK, with transactions completing in similar numbers. January alone say close to 95,000 sales transact (Dataloft, ONS) – a firm indicator for the year ahead.
As for property prices, a perennial concern: a crash is not in prospect.
The conditions that cause dramatic price corrections – i.e. forced selling, widespread negative equity, a sudden collapse in demand – are not present in any meaningful way. There may be isolated regional softening in some markets, and pockets where values plateau or dip modestly, but the overall picture is nevertheless one of resilience, not retreat.
It doesn’t mean that it will be easy, either! But we have seen this sort of market before, and we do know what we need to do to get you moved.
If you would like to understand what the current environment means specifically for your property, your mortgage, or your plans as a landlord or homeowner, please pick up the phone to us. These are exactly the conversations we should be having – and the sooner the better.
________________________________________
All market data referenced above is sourced from Dataloft by Pricehubble, Rightmove House Price Index (January 2026), Halifax, Moneyfacts, Office for National Statistics and industry transaction data current to the date of publication, 19 March 2026.
